Visual Marketing

Data: 27/11/11 · Professional

Veure els comentaris de Visual MarketingSigues el primer en comentar

More than 4 years ago the usability guru Jackob Nielsen wrote a post in his blog under the title:How Little Do Users Read? In that post Nielsen said “On the average Web page, users have time to read at most 28% of the words during an average visit; 20% is more likely.”

Although there is a old question regarding the impact of new technologies and the reading habits, it seems the online users need to have not only the old reading habits, but also new reading skills, as this old article from New York Times shows.

Nielsend discovered the users typically follow what he called the F-Shaped Pattern. This dominant reading pattern looks somewhat like an F and has the following three components:

•Users first read in a horizontal movement, usually across the upper part of the content area. This initial element forms the F’s top bar.
•Next, users move down the page a bit and then read across in a second horizontal movement that typically covers a shorter area than the previous movement. This additional element forms the F’s lower bar.
•Finally, users scan the content’s left side in a vertical movement. Sometimes this is a fairly slow and systematic scan that appears as a solid stripe on an eyetracking heatmap. Other times users move faster, creating a spottier heatmap. This last element forms the F’s stem.

Jackob Nielsen F-Reading Pattern


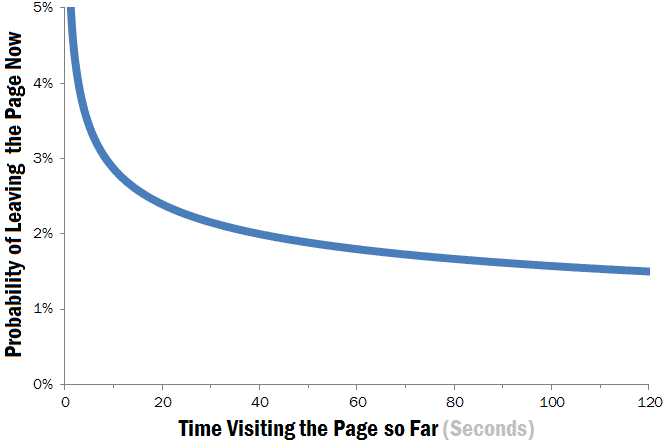
Following this reading pattern, we should include how long do users stay on web pages. According recent post from Jackob Nielsen users often leave Web pages in 10–20 seconds. According to a recent research from Microsoft the first 10 seconds of the page visit are critical for users’ decision to stay or leave.

The probability of leaving is very high during these first few seconds because users are extremely skeptical, having suffered countless poorly designed Web pages in the past. People know that most Web pages are useless, and they behave accordingly to avoid wasting more time than absolutely necessary on bad pages.


 It is clear online users behaviour is very different from online. Your content is under consideration in less than 10 seconds!

To work with that, I suggest to be as much as visual and interactive you can using all type of formats for the storytelling, from video to infographics.

Let’s see some visual engaging and viral formats that help to retain users with us:

1. New York Times Visual DNA


An interactive and visual quiz from New York Times.


2. Pleasure Hunt by Magnum


Interactive Magnum game.


3. Ted Sphere


TED Sphere Visualization


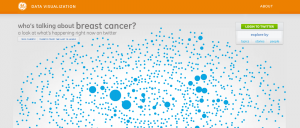
4. Data Visualization


Real time buzz visualization.


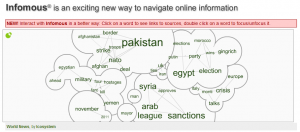
5. Infomous


Viual News from the Buzz


6. John Paulson Interactive Infographic


John Paulson interactive infographic, an example of content marketing using interactive infographic format.

The above are some examples of formats you can use in your website to improve user retention, engagement and improve your viral marketing. Let’s work Visual Marketing: The Art to Retain Users Using Visual Formats.

The future of Google algorithm based on sentiment analysis

Data: 15/11/11 · Professional

Veure els comentaris de The future of Google algorithm based on sentiment analysisSigues el primer en comentar

Google SentimentAs Google is making continuous improvements in its rank factors algorithm, probably we will see by 2012 a huge improvements on semantic technologies focused to understand consumer sentiment. 

Google is already working on reading social networks comments to learn and make relations between what’s being said in those conversations and brands, products, people…  The latest news came recently from Matt Cutts, fom Google, who said Googlebot already was able to index dynamic comments.

The next step is to improve relations between comments and type of sentiments described. Seth Grimes, an analyst strategist from Washington answer interesting questions in a recent article about The Future of Sentiment Analysis. He thinks still there is a lot to do to improve the SMA we have today, but companies like Radian6 are on the way.

Seth Grimes describe here what he looks in a Social Analysis Tool.  For him sentiment analysis is a set of methods, typically (but not always) implemented in computer software, that detect, measure, report, and exploit attitudes, opinions, and emotions in online, social, and enterprise information sources.

Google is already conducting a sentiment analysis for social media profiles such Twitter profiles or Google +1. Tools like Sharedcount can give you some idea of what is Google accounting. Along with that data, Google is also using its semantic technology to work in sentiment analysis.  

Online Reputation Management (ORM) will become much more important in 2012, as sentiment will be probably one of the most important ranking and quality factors for next year Google algorithm improvements.

We will see new Start Ups, like Bananity (coming online officialy next 23th November 2011) as online communities based on love & hate relations, or the sentiment analysis applied to journalism, as for instance what did Boston Globe with the Red Sox players and coaches popularity based on Twitter conversations. 

It will obviously impact on SEO, as the ranking factors will be more difficult to work… because sentiments are not something you can optimize fast, aren’t it?.

Marketing is now more than ever sentiment centric!

Marketing and Creativity

Data: 13/11/11 · Professional

Veure els comentaris de Marketing and CreativitySigues el primer en comentar

Last week I was as speaker at eWeek (sorry, program not available in english) organized by University of Vic, a conference week on different digital topics. In my conference session the topic was related with crowdsourcing and how Internet is changing the traditional advertising model.

To illustrate that, my colleague from Cyberclick, David Tomás, showed the following funny videos related with Pepsi ad from the World FIFA Cup 2006.

The official video (below) investment cost around 20 Million $ and got (up to now) aroud 500,000 views.

David told us that when Pepsi saw the few views, called a couple of funny chinese guys to spoof it. The cost… a free T-Shirt for them and some Pepsi… the result?… around 3 Million views.


Now, the question is… what’s happening?. Is it about money?.

No, money is not the success key on Internet. If you want to succeed online you will need CREATIVITY, a lot of CREATIVITY!!! And this is true for any business. Do you remember the case of  Blendtec videos?.. Here is an example:

 Remember… marketing is not only Analytics, SEM or SEO… is also about Creativity!. I say that because I do not see many posts within the marketing experts regarding this issue, and I think it is a really critical point.

Google’s Rating Guidelines

Data: 31/10/11 · Professional

Veure els comentaris de Google’s Rating GuidelinesSigues el primer en comentar

SEO

In the last few weeks the SEO world have had a couple of news that make us (SEO professionals) comment about it.

On one hand, on 18th October Google announced blocking as “not provided” referral keyword information on Google Analytics in those cases when users were logged in (using SSL when searching). Although it only affects between 5% and 10% of the total audience, is not the best way webmasters can improve relevance and user’s experience if we can not access to user’s intent (using the keyword referral).

It is a bit contradictory when Google uses the excuse of “user privacy” abd at the same time is using IP data for the “non privided” line at Google Analytics.

 On other hand, the SEO blogger Potpiegirl wrote a post about How Google Makes Algorithm Changes  commenting a leaked Google document, the Google’s Rating Guidelines.

 Google raters are people at Google who manually review landing pages scoring it:

portant scoring factors for URL Raters (taken from throughout the guide). According to this article on Seomoz, they rate:

  • User intent and page utility
  • Location
  • Language
  • Query interpretation
  • Specificity of the query and landing page
  • Timeliness of the informational need of the query to evaluate whether recent content is necessary
  • The language of video content vs. query and landing page content language

It seems the rating scale is based on 5 types:

  • Vital – Biographical and personal pages
  • Useful – Useful for most of users
  • Relevant – Useful for some of users
  • Slightly Relevant – Useful for niche users or few users
  • Useless – Not useful

Google classifies the users depending on their search intent as a Do-Know-Go, depending if the user wants to do a specific action (E.g. Buy), search of information or go to specific site.

In fact, it seems the document do not reveal any secret the SEO community did not already know. Here is a official Google’ post on how build a high quality sites: http://googlewebmastercentral.blogspot.com/2011/05/more-guidance-on-building-high-quality.html 

In my opinion, if you work the “K-C” you will rank up:

  • Knowldege – Provide fresh and updated knowledge and value to users
  • Conversation – Provide conversation, interaction, engagement to users


e-Commerce Revenue Estimates

Data: 19/10/11 · Professional

Veure els comentaris de e-Commerce Revenue EstimatesSigues el primer en comentar

eCommerce Conversion Funnel

One of the most common questions regarding new e-Commerce projects is how to calculate revenue estimates.

For me one easy way is to take 3 factors to calculate it (I’m not describing here ROI, I’m here talking about revenue estimates calculation):

Audience = Absolute Unique Visitors (daily, monthly…).
Conversion Rate (%) = Buyers/Absolute Unique Visitors.
Average Purchase Value = From site purchase past date try to stablish an average (daily, monthly…) purchase value.   

I personally prefer to use Absolute Unique Visitors as a audience metric because I think the purchase capability belongs to each single people, not visitors or page views.

From here you can download an Excel spreadsheet (download in ZIP format) to calculate it. Just change the different figures to adapt it for different forecast patterns.

At the end there is no secret. To reach a revenue goal you can work on volumen or quality, that is increasing audience or conversion.


Women and Social Media: The Secret for Success

Data: 13/10/11 · Professional

Veure els comentaris de Women and Social Media: The Secret for SuccessSigues el primer en comentar

Social Media - WomenAccording with the latest Nielsen Social Media Report (Q3 – 2011), females make up the majority of visitors to social networks and blogs, and people aged 18-34 have the highest concentration of visitors among all age groups. Americans aged 35-49 are also avid visitors: 4 percent more likely than average to visit social networks and blogs than they do any other site and 27 percent of these sites’ audience.

According to the survey, more women view video on Social Networks, but men watch longer.

Females spend more time than males on social media sites according to Pew Research Center. They also contribute more, use mobile social networking more and they buy more stuff online than men do.  More women than men use Facebook and Twitter regularly. They perform Facebook status and profile updates more regularly, comment more, add more photos and click the Like button more than men. If it were not for the constant feminine energy fueling Facebook on a daily basis, the site would be dead.

Social Media Women Distribution

Men and women are equally likely to have internet access: 73% of men and 75% of women go online. However, in a familiar pattern, women continue to pull ahead when it comes to pursuing health information online:3 86% of online women do so, compared with 73% of online men according to a Pew Survey.

According to Chief Marketer, 47% of women search for coupons and promotions online, whereas there are only 33% of men are looking for such discounts online. Another interesting statistics is that they found men (36%) are more inclined than women (28%) towards finding information about a product while interacting with a retail brand through social media.

Shopper Centric (a website that analyzes shopping behaviors and trends) conducted a research on 1,000 people, which helped in giving a general insight on how men and women use social media for online shopping. According to them, 38% men use a smartphone as opposed to 29% if women; 60% of women use Facebook actively as compared to 52% men.

According to a report by ComScore, “Women on the Web”:
•Average time spent online by men is 22.9 hrs, whereas women spend 24.8 hours.
•Women spent an average of 16.3% of their online time on social networks in April 2010, compared to 11.7% of men.
•When it comes to Twitter, men mostly post their own tweets, whereas a larger percentage of women users use Twitter to find deals and promotions. Women are more likely to use this service as a conversation medium and to follow celebrities.
•Women surpass men when it comes to the reach and time spent on photo-sharing sites.
•The number of visits on retail websites is more or less the same for both the genders for all age groups, but women tend to spend more time on these websites than that of men.
•On an average, men conduct more searches per searcher then women (71.6% per searcher for men vs. 64.0 for women).

Most women use Facebook to keep their friends informed about what they are doing, but few have tolerance for friends who use the site to brag or over-share, according to a survey from Eversave that also explores group-buying preferences among women.

Despite such occasional annoyances, women appreciate Facebook for allowing them to view friends’ photos and videos (91%), find long-lost friends (76%), and learn about promotions and deals from their favorite brands (75%).

Below, other findings from Eversave’s online survey of 450 women who use Facebook.

Most women say they post status updates on Facebook to stay in touch with people and share interesting content:

77.6% post updates to keep friends informed.
64.0% share interesting or funny links and videos.
44.5% promote social causes.
24.3% post updates to brag about something.
Such women are active on Facebook: 83% say they check the site 2-10 times daily and another 15% check Facebook once a day.


A recent Nielsen survey called Women of Tomorrow shows that women talk 28 percent more and text 14 percent more than men every month; they are also heavier users of social features of phones and visit more Internet community sites than men.  And, more than half of women in both developed (average 56%) and emerging (average 71%) countries say the computer, mobile phones and smart phones have changed their lives for the better.

Social networking is a fundamental part of a woman’s day-to-day digital life, with 65 –  70 percent of active, online female users age 18 plus in developed markets such as Australia, France, Italy, South Korea and Brazil visiting the leading social networking site in their market.  In the U.S., 73 percent of online women visit the leading social networks while in Germany, 50 percent visit.

“To connect with women, strategies should be social and relevant,” said Whiting.  “With social networking, women typically follow brands more so than men, making the social networking tool relevant for discounts, deals and coupons. Women are much more likely to engage with media that seamlessly integrates into and improves their day-to-day lives.”

Across 22 forms of advertising “recommendations from people you know” is by far the most trustworthy advertising source for women surveyed in developed (73%) and emerging (82%) countries, followed by branded websites (60%, emerging countries) and consumer online opinions (49%, developed countries).

– Women in emerging markets are more highly influenced by web ads shown on social media sites than those in developed countries. In emerging countries, women in India were the most highly influenced by web ads and women in South Africa and Russia were least persuaded.  In developed countries, respondents in South Korea were most moved by social advertising and women in Australia and France were most impartial.

– When it comes to life decisions, women respondents in developed markets want shared responsibilities on all matters from child care to major purchases. In emerging markets, some traditional roles continue, yet there is a desire for shared responsibility.  Men in emerging countries are still viewed as the primary decision-making stakeholders when it comes to purchasing home electronics or cars, while women rule in the health and beauty department and all child care matters.

– Across countries surveyed, some traditional sentiments remain: 31 percent of both men and women believe that men are the best fit to hold political office, maintain workplace positions of authority (29%) and make major purchases (22%).

“The next generation of female consumers will shop and use media differently, from men and generations before them, “said Whiting.  “Consequently, companies marketing to women and working to capture women’s attention must rely on informed insights rather than assumptions about how they do business with this influential consumer.”

Users Search Behaviour: Google Eye-Tracking

Data: 07/10/11 · Professional

Veure els comentaris de Users Search Behaviour: Google Eye-TrackingSigues el primer en comentar

A quick post just to say that the latest Eye Tracking tests made once again demonstrate most of the people do not continue searching to #2 SERP’s page and even many of them do not do page scrolling. Good findings that confirm the importance of SEO.

From a recent post at SEOMoz the findings on the Eye Tracking Google’s SERP’s were clear: 

Google SERP's Eye Tracking

This screenshot is for searching “best pizza in Chicago” in Google.

For all other keywords used in the testing the conclusions were similar and can be listed as follow:

a)  Top results have much more impact the the bottom of the page.

b) Google Maps has a very high impact, even if you are not in the first of the Google Maps listing.

c) No always first position is has the most impact… it depens on visual effects around the information. That’s why it is important for SEO to work also videoplacement and other snippets around the result.

Just to remember I show again the below data, that is quite similar as above visual results:

Google Search SERP's impact position on click behaviour

Strategic Social Media Tools

Data: 28/09/11 · Professional

Veure els comentaris de Strategic Social Media ToolsSigues el primer en comentar

Social Media ToolsThere exist more than 500 social media monitoring tools. Obviously I do not know all of them, but from those I have had the opportunity to test I specially have been interested in the following described below.

Below list does not mean those are the best tools neither the most complet ones, but for me are at least different from many others.

1. FOLLOWER WONK

“Looking for prospects? Whether it’s new talent, customers, or just friends, we help find whom you’re after.”

Search en Twitter bios user’s profile. Very useful to find people filtered by profession, likes of other description people may be described into the Twitter bios.

Examples: lovers & haters, CEOs, SEO, social media, actors, journalists, NYC architects, vampires? 

You can also analyze, compare an track followers.

For instance, for “SEO” you may find more than 46,000 Twitter users related with SEO worldwide.

 2. UPDOOD 

Updood could be described as the local Twitter ranking tool. ” Get Top Twitter users by city and follow them in a few seconds!”

Although is not perfect because it depends on the users to have correctly complete their profile, it is quite useful to see at a trending level the most dynamic Twitter people in your city/town.

3. MENTIONMAPP

Very nice Twitter users graph visualization. You see the relations and the conversation topics.

“Quickly find relevant people to follow!  Use Mentionmapp to see Twitter conversations as a network and click any user to explore.”

4. TRENDSMAP

Twitter trending topics worldwide map. “Trendsmap.com is a real-time mapping of Twitter trends across the world.”

5. KLOUT

How influential are you?. A influence Twitter users rating. It is fun… I do not know how useful it can be… Still testing.

6. TWITTERCOUNTER

“Twitter Counter tracks statistics of more than 10 million Twitter users”. An statistical tool to see how dynamic are you or any Twitter user (that is indexed into this tool).

7. TOUCH GRAPH

 Very nice visualization tool for your Facebook connections (graph nodes map)

“TouchGraph Facebook Browser lets you see how your friends are connected, and who has the most photos together. Explore your networks by graphing photos from anyone’s album, or view the connections between members of a group.”


The above tools focus on the user (except Trensmap), not only on the conversation. It means it allow to study users relations, which in my opinion is even more important than user’s conversations. Why?, because you can identify KOL (Key Opinion Leaders) studying the user relations. Imagine you could apply PageRank to user relations… get the idea?

The Social Rank should be defined not only by quantity but also quality of those personal relations. We should work the algorithm. Google when we start? Google+ is not  enough, you need different social media sources of personal information.

Finally, as a curiousity here you have the Mapping New Testament Social Networks


Jesus Social Network

Jesus Social Network


Online Reputation: The Crowdsourcing Marketing

Data: 23/09/11 · Professional

Veure els comentaris de Online Reputation: The Crowdsourcing MarketingSigues el primer en comentar


Online Reputation

Welcome to my new blog.  It  wants to give to my friends, fans and followers (whatever you want to express it) a more complet vision on my thoughts based on 3 pillars: professional, politics & social and vital (personal) thoughts.

Once said it, let me use this first post to write a few lines about Online Reputation.

Recently I had a very bad experience with a real state company I rented my apartment. They simply did not want to refund me the deposit I paid when I left the apartment.

When someone’s attitude with the customers is so miserable the first thought it came to my mind was: The problem of this company is not (only) about their customers care, it is worst, it is about taking care of themselves, it is about their brand and corporate reputation…

Let’s list 10 costs to avoid related with Negative Online Reputation:

  • Loss of brand confidence
  • Brand image damage (brand frustrated emotions and expectations)
  • Potential spread of negative message through social networks
  • Obviously,  lost of customers
  • Probably, sales decrease… may be not in short term, but in middle and long term
  • Who wants to work with a bad reputation brand?
  •  High cost (money and time)  to rebuild prestige for the brand
  • It (people negative comments, messages, posts…)  may be out of your marketing and press department control
  • Advantage for your competitors
  • Who will solvent the problem once created? Same people who did not avoid it occur? Are they ready and know how to deal with Online Reputation Management (ORM)?

Some years ago I had the opportunity to work with an online reputation case for global consumer’s food brand. When typing their brand in the Google search box, the Google suggest system came out with 6 negative attributes associated to the brand from 10 results list… and in organic SERP’s from 18 results, 5 of them where at the upside of the screen…

The problem was that meesages did not were true, but at corporate lever nobody was ware it was happening or it was considered not important. After 6 month it was first priority for the communication department because among others pergned woman started not buying the product thinkig it was not healthy for them, among other customers.

In other case I was leading with the problem was nobody wanted to go to work with my customer’s company. An ex-worker posted in a blog some lies about the company relation with the employees. Furthermore, some of the customers returned some of the purchased products. Still today they are on legal issues.

Yes, users and customers have the power, the brand power. In this new scenario, some actions need to be taken from corporations:

  1. The company staff is the brand. Any single customer conflict may be, if not solvented, a digital brand bomb. From customer’s care departments up to sales and marketing, all who deal with customers have in their hands the responsability to take care of the brand they are working for.
  2. All must be user and customer centric. Forget old times where corporations had the power. Not anymore!. Online, people have the power, buzz is the weapon.
  3. Be ready to have people skilled in deactivating digital brand bombs (angry users/customers).
  4. The human value marketing (sincerity, kindness, love, service, truth, trust …) is the new marketing. Hire people with true human values.
  5. If you do things well, do not worry. Customers will be your best department of communication  (Eg. Apple). If not, be ready for the war, the brand war.

Still today I hear opinions coming from companies they are afraid in being on Social Networks. I always say the same: “do not worry, you are already on Social Networks, people is already commenting on you”.

Online Reputation is the new marketing, Crowdsourcing Marketing!.  People build the brand, not the company. Is your company ready? And you?.